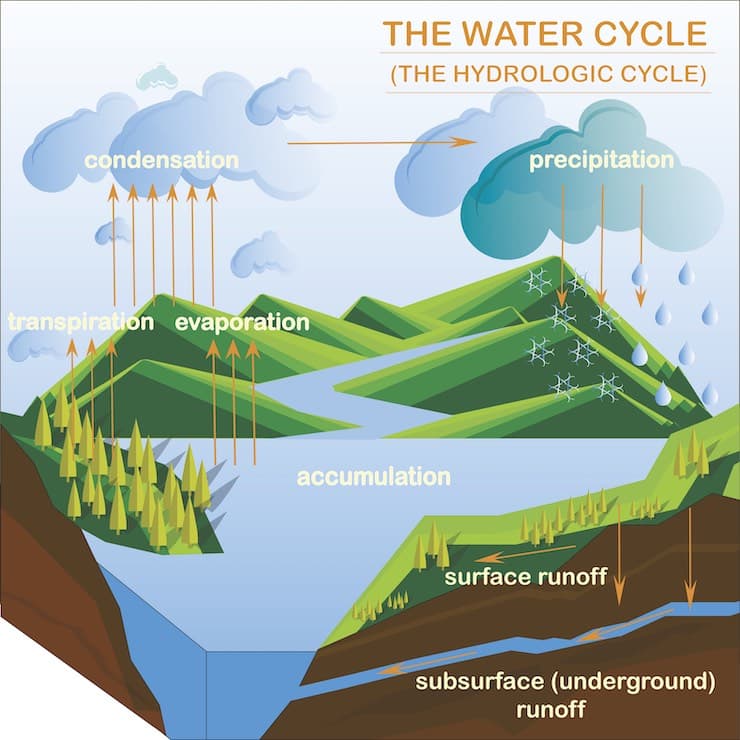
The word ‘evapotranspiration’ – a compound word made up of evaporation and transpiration – describes the process of water shifting from either the ground or plant life and into the atmosphere. Water which is vaporized from either a body of water or the surface of the ground is said to have evaporated, while transpiration describes the way in which water caught on the leaves of plants enters the air. Many factors make the tracking and analysis of the phenomenon of evapotranspiration somewhat problematic in terms of gathering data that can be relied on - and tapping into a consensus view on what that data means.
Evapotranspiration cannot be ignored by anyone managing, designing or installing a large-scale irrigation system, since, as we’ll explore later in this article, it represents one of the key metrics on water supply and demand (second only to precipitation), and is one of the environmental factors which is likely to be most impacted by the rising temperatures brought about by climate change. This is particularly the case for anyone working in irrigation in Florida which, according to figures published by the US Geological Survey, historically has the highest mean annual evapotranspiration in the conterminous United States (only Puerto Rico has higher levels).
In the south of Florida in particular, (as pointed out in an early-2000's paper published by the South Florida Water Management District) evapotranspiration represents one of the major components of the water cycle – also known as the hydrologic cycle – and as such needs to be ranked alongside the other metrics which irrigation managers generally record and track, such as precipitation and soil moisture levels. Higher levels of evapotranspiration for example, may impact on the amount of water which is running off from plants and soil beds and eventually finding its way to helping replenish the subterranean aquifers supplying the bulk of the drinking water essential in places like north east and central Florida.
This is an issue which might not appear to impact directly upon irrigation management in the short term, but could still have a dramatic effect on water supplies across Florida in the longer term, particularly as temperatures rise.

Conversely, low levels of evapotranspiration could occur under drought conditions, as plants attempt to preserve what little water they have in their systems before it is subject to transpiration. It is contrasts of this kind – in which both high and low levels of evapotranspiration could impact on the amount of irrigation needed in a specific location – which make it a difficult topic to deal with. In simple terms, more rainfall means less irrigation water is needed, but more evapotranspiration could signal that too much water is being applied initially, or alternatively (or even simultaneously) that more will need to be applied going forward. This is partly down to the relative difficulty in tracking levels of evapotranspiration when compared to other key irrigation metrics, and partly to the sheer number of external factors, over and above irrigation, which might be impacting on the levels of evapotranspiration.
In simple terms, evapotranspiration is largely influenced by solar radiation (sunlight, to use the non-technical term), temperature, wind speed, atmospheric pressure, relative humidity and the type and condition of the vegetation being monitored.
To use South Florida as an example, this is an area of high rainfall, high humidity and low wind speed. The air temperature is generally high - even during the winter months, and solar radiation is present throughout the year with seasonal and daily variations. In this particular environment, the daily fluctuations in evapotranspiration can mostly be explained by solar radiation, which means that an accurate prediction of the hours of sunlight on any given day should – all things being equal – make it easier to predict the levels of evapotranspiration likely to be experienced.
Although we’ve mentioned a few of the factors present in a region such as south Florida which might impact on the levels of evapotranspiration present, it’s probably worth listing a few other factors which, alongside the meteorological factors already detailed, impact on the levels of evapotranspiration experienced across Florida:

To complicate matters further, there are two types of evapotranspiration which need to be monitored and factored into decision making when planning or delivering irrigation on a mass scale.
The first of these is Potential Evapotranspiration (PET) which is the evapotranspiration which would be expected from a sizeable area of land with vegetation growing on it which has access to sufficient moisture. With no restrictions on moisture, the level of PET is dependent upon other factors such as solar radiation, humidity and wind.
The second type of evapotranspiration which needs to be tracked is Actual Evapotranspiration (AET) which, as the name suggests, is the measure of the actual evapotranspiration taking place in a specific location under real-time conditions. If the location in question is being irrigated sufficiently, then the ratio of AET to PET should be 1, with the moisture in the soil hitting field capacity. When the water supply isn’t sufficient for the purposes of irrigating the vegetation present then the ratio will slip to less than 1. If the soil in question has sufficiently high clay content however, meaning that it holds more of the water which manages to penetrate the surface, then the ratio of AET to PET should stay close to 1 even if the amount of moisture available has been reduced by 50%.
Some of the key differences between AET and PET are as follows:
The US government website for the National Centers for Environmental Information (NCEI) is home to a vast archive of environmental information and also contains an explanation of PET in relation to the Palmer Drought Severity Index, a means of measuring ‘the duration and intensity of the long-term drought-inducing circulation patterns.’ This measure makes use of PET as calculated using the temperature, to arrive at a figure for the maximum amount of water that would be evapotranspired if enough water were available via a combination of precipitation and moisture held in the soil. AET is the actual amount of water which is being evapotranspired, a figure which is always limited by the amount of water which is actually available.
AET will always be either less than or equal to PET, and so the equation relating to drought uses PET as the yardstick against which the amounts of water available and required are measured. If the precipitation during a given month is greater than the PET then the leftover water will soak into the ground to maintain levels of soil moisture or run-off and drain away. If the amount of precipitation is less than PET, however, then moisture will have to be drawn from the soil to meet the demand for PET. Higher temperatures will result in greater PET which thus requires more precipitation to meet the greater demand.
The issue, of course, is that higher temperatures are often accompanied by a drastic reduction in, or total lack of, precipitation. This leads to PET which is higher than the precipitation present, thus causing drought conditions. In a climate like Florida’s, where we're seeing increasingly high temperatures, the use of highly targeted, large-scale irrigation in order to avoid the landscape slipping into drought conditions is becoming ever more vital. At the same time, however, the rise in temperature means that water has to be utilized more carefully than ever.
According to figures published by the aforementioned NCEI, North America as a whole experienced the warmest ever July-October period in 2022, compared to temperature records kept since as long ago as 1910. The increased heat pushed levels of evapotranspiration to peaks which damaged crops in the western and central areas of the US, while portions of the south and west have been in drought since summer 2020 and the so-called Four Corner states in the southwest have had drought conditions since 2017.
Closer to home, the summer of 2023 in Florida saw an unusually hot summer following on from a hurricane season which included Hurricane Ian and Hurricane Nicole, the first hurricane to hit Florida in November in 36 years and only the third ever in that month. We’re used to hurricanes in Florida of course – according to figures published in The Economist the state is hit by 40% of the hurricanes in the US as a whole – but the warming sea temperatures mean that the hurricanes being experienced now are rising in intensity. Hotter seas and more destructive hurricanes are just two clear signs of the impact which the changing climate is having in Florida.
According to a report entitled Global and Regional Sea Level Rise Scenarios for the United States, published by bodies including the National Oceanic and Atmospheric Administration, Florida International University and NASA, the sea level around the Florida could rise by 18 inches between now and 2050,while other experts are warning that the impact will be such that almost 60% of Miami-Dade county will be underwater by 2060. Meanwhile, analysis by the Climate Central website found that, between June and August 2023, a number of cities in Florida posted record overnight temperatures multiple times. Sarasota did so 13 times, Orlando 10 times and Tampa 12 times, for example.

The impact of rising temperatures across Florida as a whole is clear then, but the effect this will have on levels of evapotranspiration, and the measures needed to be taken to cope with this shift is something which climate scientists are still evaluating on a global basis.
A 2020 paper published by Nature.com looked at the links between rising temperatures across the US, the rise in evapotranspiration driven by this shift and the impact this rise would have on the levels of groundwater present in the soil. The study used three different scenarios to simulate the impact on the hydrologic cycle of temperature rises of 1.5, 2, and 4 °C, representing three predictions for what could happen to temperatures during the 21st century. In all cases increasing temperatures led to greater evapotranspiration and meant that this loss of water to the air would mean less water replenishing supplies stored underground (of the kind on which Florida heavily relies).
These findings were based on a constant supply of water being applied to the areas under observation, which means that increasing irrigation during hot periods will not only keep the vegetation in question in a healthy state, but will also stop it slipping into an arid and lifeless state. The study also found that the increase in evapotranspiration triggered by rising temperatures was seen to greatest effect in the east of the US, and in those states where the water supply is sufficient to keep pace with that increase.
Findings of this kind are confirmed by another research paper – ‘Recent Increase in the Observation-Derived Land Evapotranspiration Due to Global Warming’ – published by IOP Science in December 2021. This paper, as the title suggests, looked at evapotranspiration levels globally and tracked the degree to which these changes are being driven by rising temperatures. The findings were that evapotranspiration levels had been driven higher across the globe in recent years, and that 87% of this rise could be attributed to rising temperatures.
Finally, a paper published in March 2023 looked at levels of evapotranspiration in Sicily across a period running from 2002 to 2022. The findings of this paper were that, since rising temperatures can trigger an increase in evapotranspiration, an understanding of exactly when PET is likely to be higher will be needed in the future by anyone engaged in planning the delivery of irrigation. By looking at multiple locations and gathering data across a relatively long period of time, this study was able to identify monthly trends in specific location, and to flag up the places where increased evapotranspiration was most likely to impact on the amount and frequency of the irrigation needed, as well as the months of the year when this is likely to be the case.
Data of this kind is likely to be as important when scheduling and planning irrigation delivery in the future as metrics such as precipitation and temperature have been in the past. The good news for those of us working in the field of irrigation in Florida is that such data is fairly readily available. The University of Florida has published a number of articles looking into the subject of evapotranspiration-based irrigation and, although these articles specifically relate to irrigation for agriculture, the principles they outline apply just as readily to landscape irrigation.
As the research suggests, evapotranspiration levels could be used to increase the efficiency of any irrigation system by fine-tuning the water being delivered to exactly meet the demands of the plants and the soil. The methods recommended include the use of evapotranspiration-based irrigation controllers which utilize one of the following:
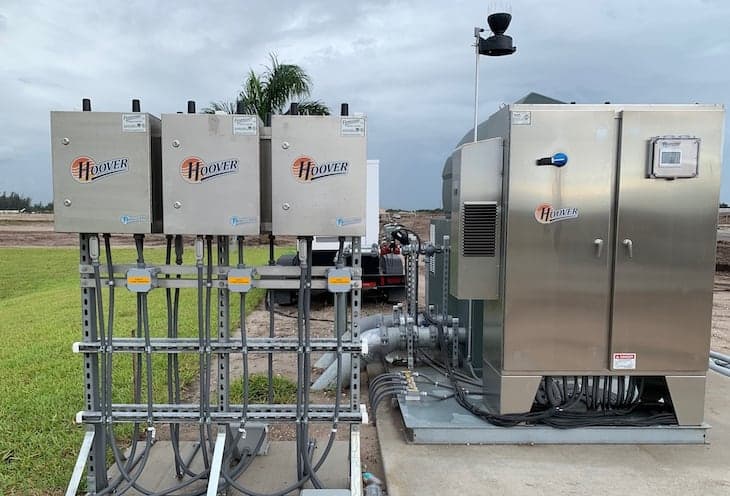
Here at Hoover, our Flowguard® software gives communities and service providers simple, user-friendly tools to monitor irrigation 24/7, 365 days a year. It helps them ensure that every zone is running at the required flow/pressure needed for proper coverage, the correct duration and the amount to be used. Additionally, they are able to integrate all weather activity into the scheduling so their field gets what it needs when it needs it. Without seeing what the entire system is asking for and validating what it is receiving, it would simply be a guessing game. Flowguard® is the constant that monitors an irrigation system night and day.

As stated in the article, controllers of this kind are generally designed specifically for landscape irrigation, and may be equipped with an additional rain measurement facility in order to account for the fact that precipitation levels can vary widely across different parts of Florida, and at different times of the year. The article also suggests the ‘do it yourself’ method of calculating the right irrigation levels on the basis of evapotranspiration data which is easily accessed from public weather network databases.
The university itself provides the evapotranspiration rate across Florida for the last 7 days at any given time, measured in inches on a daily basis, while historical trends can be accessed at the U.S. Geological Survey website.
Interpreting data of this kind and calculating the impact on irrigation requirements is hugely complex. Nevertheless, it is certain that the advanced smart irrigation systems, utilized by organizations with large scale irrigation requirements – from golf courses and sports fields to gated communities and business parks – will in the future, have an evapotranspiration component designed and built into them from the earliest stages. Even if the general rise in temperatures slow down, increased evapotranspiration will be here to stay, and irrigation systems that don’t allow for this will be inefficient, wasteful and less than fully effective.